 S2P
S2P
Tutorial: case study 2
This quick-start tutorial will guide you through all the steps needed to (i) import a single Progenesis SameSpots report, (ii) associate the MALDI plates used in the experiment with their corresponding Mascot reports, and (iii) use the integrated analysis view of S2P.
Contents
- Download the sample dataset
- Import a single Progenesis SameSpots report
- Associate the MALDI plates
- Integrated data analysis
1. Download the sample dataset
Before using S2P, please, download the sample dataset here and uncompress it. You will find a README.txt file explaining the contents of the dataset, namely:
- Samespots Report: directory containing the HTML files corresponding to the reports generated by Progenesis SameSpots.
- Spots: a directory contaning the CSV files generated by S2P to store spots data.
- Maldi plate: contains files related with Maldi plates.
- Mascot identifications: contains files related with the Mascot identifications.
- Processed Spots: contains files that store procerssed spots data (i.e. created from files in Spots in order to add the Mascot identifications). This files can't be opened with S2P but with third party software (e.g. R, LibreOffice, Excel, etc.).
This dataset contains spots data from 10 patients receiving a peritoneal dialysis treatment. Peritoneal dialysis effluent (PDE) samples were collected from patients following a peritoneal equilibrium test in different time points. Each patient's sample was analyzed using 2D-gel electrophoresis. Then, the 'Progenesis SameSpots' software was used to compare each patient's samples. Differentially expressed spots (those in 'Samespots Report' directory) were excised and analysed through MALDI-TOF mass spectrometry. Obtained spectra were submitted to Mascot in order to obtain a list of protein identifications.
In this tutorial, only the processing of the report corresponding to Patient IE is shown. Processing of other reports is done similarly.
2. Import a single Progenesis SameSpots report
S2P allows you to import data from a single Progenesis SameSpots report (HTML file). This report is generated by the Export report option of Progenesis SameSpots.
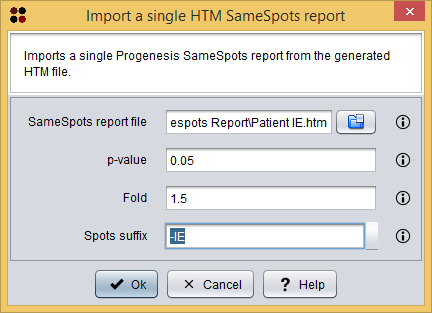
Each single report can be imported into S2P using the menu Import/Samespots/Single HTM report ( ), which will show you the Import report dialog. As you can see in the following image, this dialog requires you to provide the following information:
- SameSpots report file: the HTM file report generated by the Protenesis SameSpots software.
- To follow the tutorial, select file SameSpots Report/Patient IE.htm.
- p-value: the maximum p-value allowed for spots to be loaded. Spots within a higher p-value will not be loaded.
- Fold: the minimum fold allowed for spots to be loaded. Spots within a lower fold will not be loaded.
- Spots suffix: the suffix to add to the spots identifiers.
- To follow the tutorial, type -IE. This is the suffix used in the MALDI plate to identify this sample.
Once the report have been imported, the SameSpots analysis editor is opened. This interface allows you to: edit spots identifiers, define the experiment conditions, assign them to samples, edit samples' names, merge samples and export the spots into a CSV file.
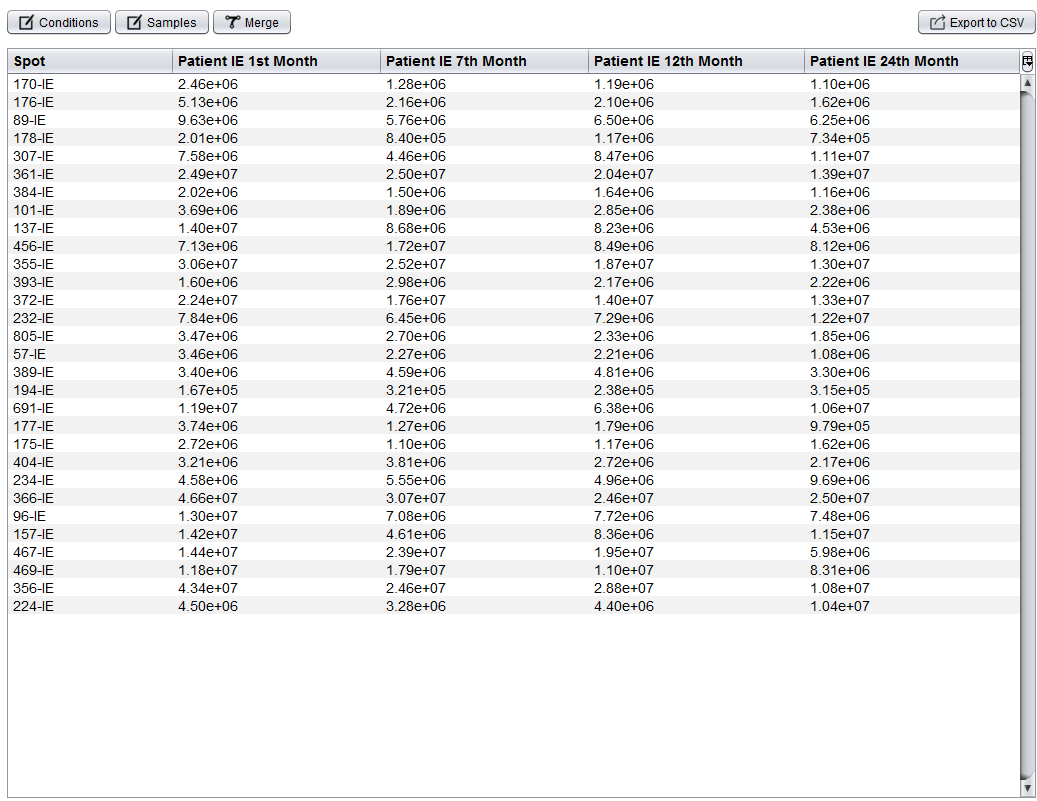
Since in this report conditions and sample names are imported right, you just have to export the prepared spots data into a CSV file by clicking the  button, which will show you the following dialog. This dialog allows you to select a file to save your data as well as to define the CSV format.
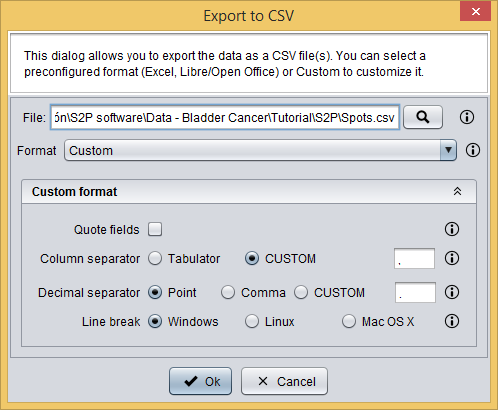
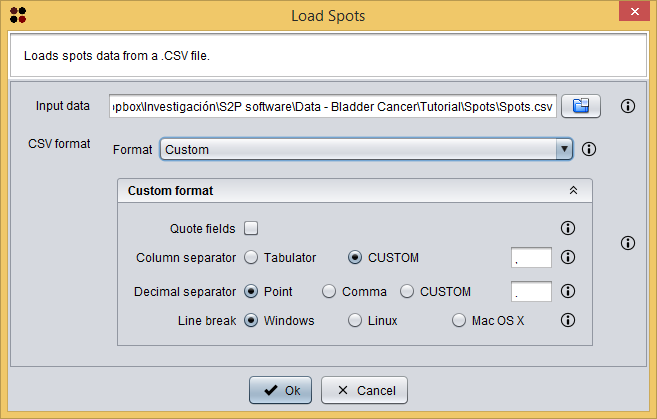
Once spots are exported into a CSV file, this new data is automatically opened by S2P. This file is also provided with the sample data at Spots/Patient IE.csv and it can be opened by using the  button, which will show you the Load Spots dialog. This dialog just requires you to provide the *.CSV file of the spots and the CSV format of the file. All files in Spots directory have a `Custom format` where fields are not quoted, `,` is the column separator, `.` is the decimal separator, and `Windows` is the line break.
Note: in some cases, to improve the probability of a positive identification (e.g. in a small spot, with pour amont of protein, etc.), same spots from different patients were joined to get a higher probability of identification. Due to this reason, some spots had been renamed in this step so that they can be associated properly with the MALDI matrix. Spot data provided in CSV files (directory `Spots`) already contain the right spot names.
2. Associate the MALDI plates
S2P allows you to desing MALDI plates for your experiments and print them into PDF so that they can be used inside the laboratory.
Sample data provided includes the MALDI plates used for this experiment: Maldi plate/2015.12.21_PDE_peptidos_longitudinal_study.mpl and Maldi plate/2015.06.02_LP_patient_longitudinal_study. As shown in the case 1 tutorial, these plates can be loaded into S2P using the menu Load/Maldi plate ( ) and then associated to the Mascot identifications. Nevertheless, in this tutorial you are going to directly associate them to their Mascot identification files.
MALDI plates and Mascot identification files can be associated to create a Spot identifications data. This associated set of spots can be integrated later into the Integrated analysis view and saved as a CSV file. This is useful in experiments involving several MALDI plates and Mascot identification reports as it is the case of this dataset.
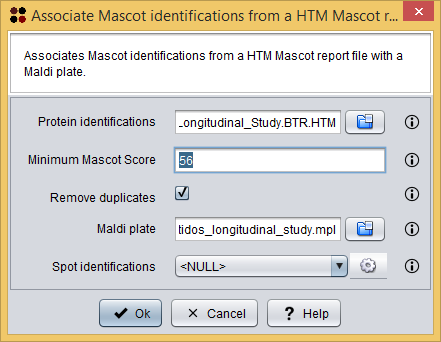
This procedure can be done using the menu Operations/Associate Mascot identifications from a Mascot HTM report file ( ), which will show you the Associate Mascot identifications dialog. As you can see in the following image, this dialog requires you to provide the following information:
- Protein identifications: the Mascot HTML report file.
- To follow the tutorial, select file Mascot identifications/2015.12.21_PDE_Peptidos_Longitudinal_Study.BTR.HTM.
- Minimum Mascot Score: the minimum Mascot Score allowed for identifications to be loaded. Identifications within a lower Mascot Score will not be loaded.
- To follow the tutorial, introduce 56.
- Remove duplicates: whether duplicated identifications must be removed or not.
- To follow the tutorial, let this option checked.
- Maldi plate: the Maldi plate file.
- To follow the tutorial, select file Maldi plate/2015.12.21_PDE_peptidos_longitudinal_study.mpl.
- Spot identifications: the destination data where the new associations must be added.
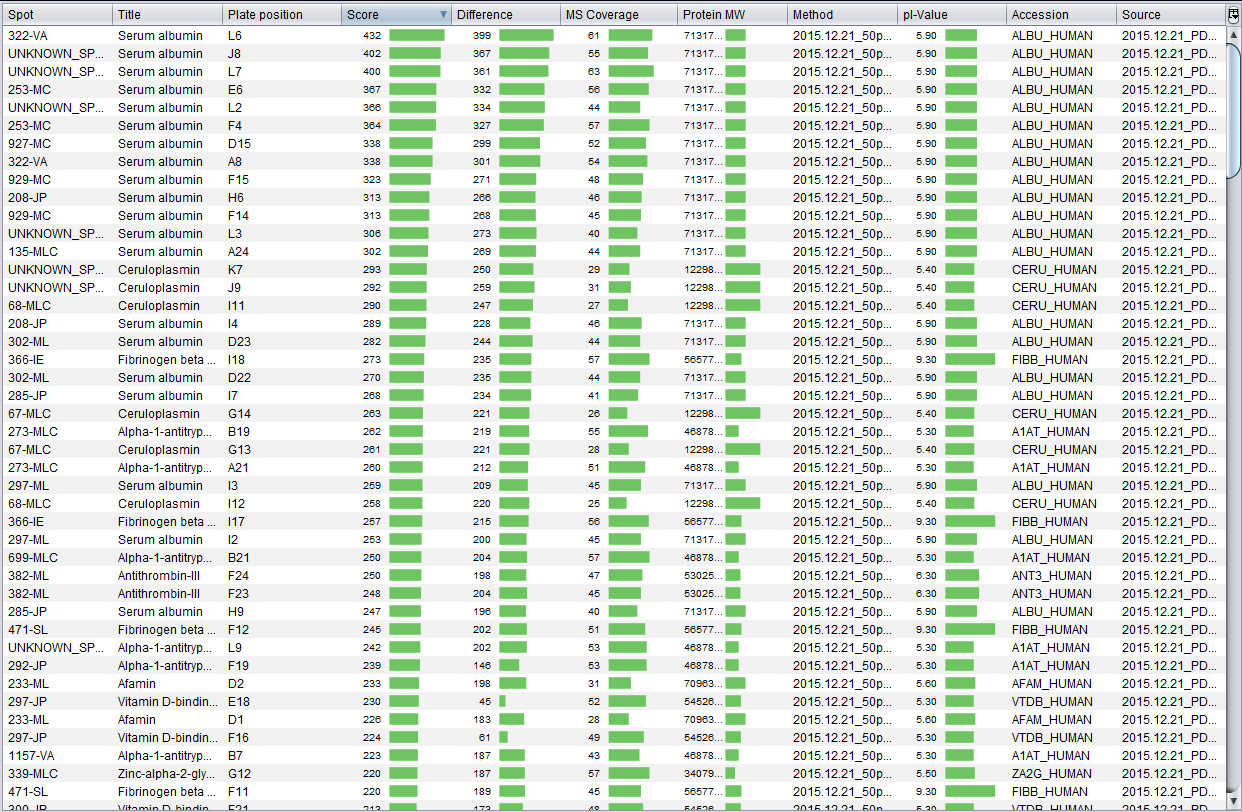
Once the two files has been associated, the Spot Mascot identifications table is opened. This interface allows you to: remove undesired protein identifications and export the spot Mascot identifications into a CSV file. As you can see in the image bellow, this is essentially the Mascot identifications table with an additional column indicating the spot.
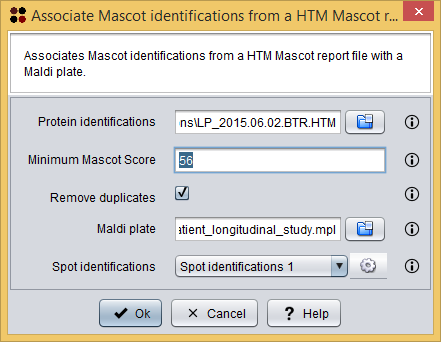
After the association of the first MALDI, you must associate the remaining one. To do so, use menu Operations/Associate Mascot identifications from a Mascot HTM report file () again in order to show the Associate Mascot identifications dialog. As you can see in the following image, this dialog requires you to provide the following information:
- Protein identifications: the Mascot HTML report file.
- To follow the tutorial, select file Mascot identifications/LP_2015.06.02.BTR.HTM.
- Minimum Mascot Score: the minimum Mascot Score allowed for identifications to be loaded. Identifications within a lower Mascot Score will not be loaded.
- To follow the tutorial, introduce 56.
- Remove duplicates: whether duplicated identifications must be removed or not.
- To follow the tutorial, let this option checked.
- Maldi plate: the Maldi plate file.
- To follow the tutorial, select file Maldi plate/2015.06.02_LP_patient_longitudinal_study.mpl.
- Spot identifications: the destination data where the new associations must be added.
- To follow the tutorial, select Spot identifications 1 so that these new set of associations is added to the previous one.
We have also exported this data into a CSV file, which is provided with the sample data at Mascot identifications/MascotIdentifications_WithSpots.csv. If you want to load this CSV file using the Load/Load spot identifications operation, note that this CSV has a `Custom format` where fields are quoted, `,` is the column separator, `.` is the decimal separator, and `Windows` is the line break.
4. Integrated data analysis
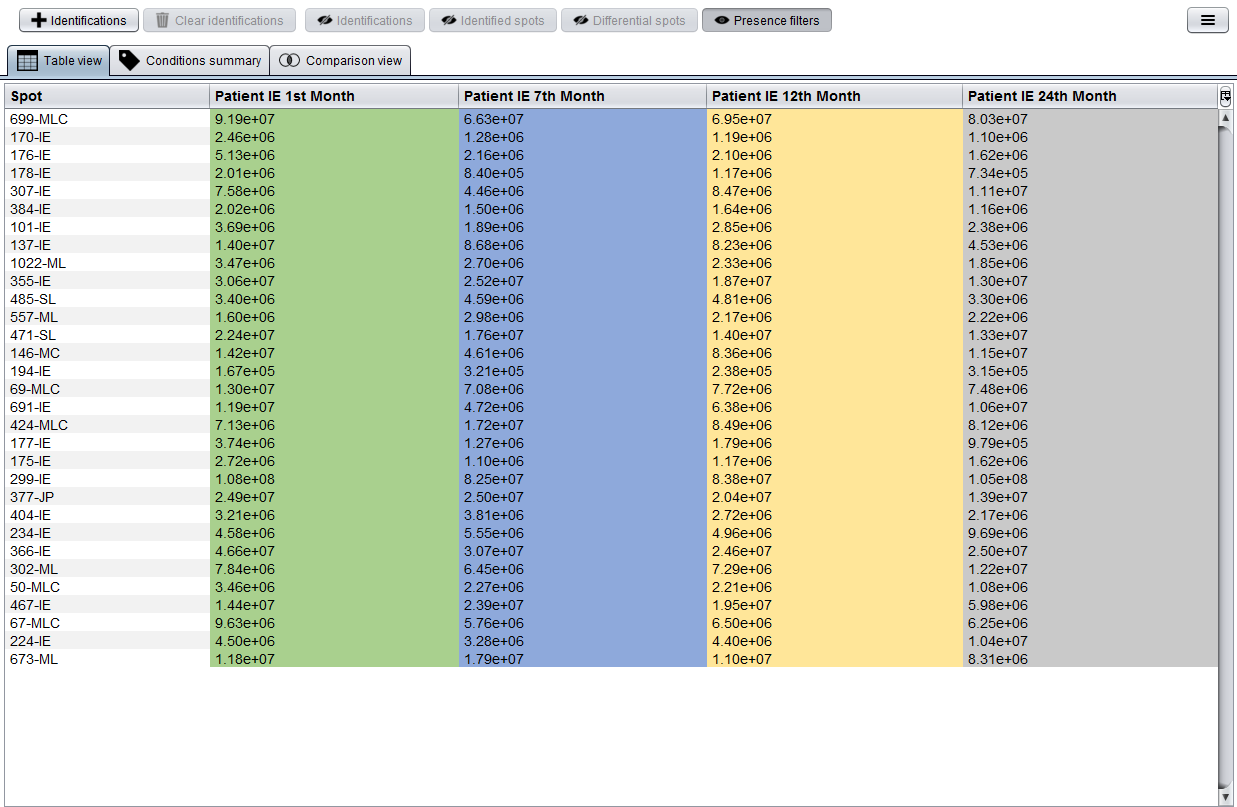
At this moment you have loaded two types of data: spots and and associated Mascot identifications. By clicking on the Patient IE.csv item the Integrated analysis view will be opened. A detailed description of this view can be found in the equivalent section of the first case study tutorial.
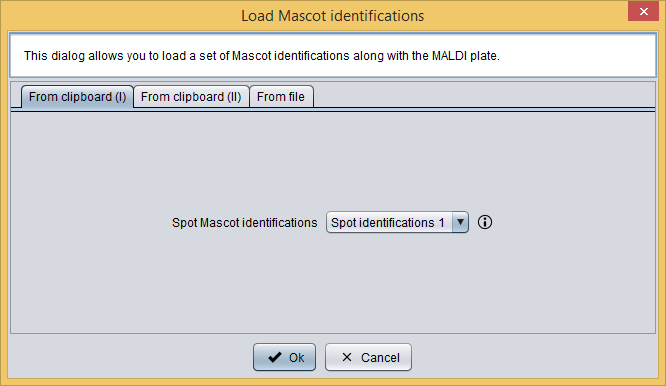
Now, in order to integrate the Mascot identifications into this analysis you should click the  button, which will show you the Add identifications dialog. As you can see in the following image, this dialog allows you to select the previously loaded spot Mascot identifications.
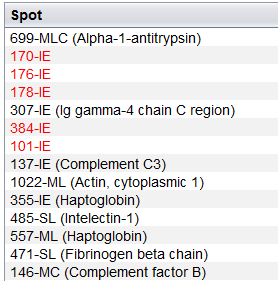
After adding this information to the analysis, tables will automatically show the best Mascot identification (i.e. that with a higher Mascot Score) along with the spot number or mark in red those spot without identifications associated.
Finally, we have exported patient's spot data along with the corresponding identifications into a CSV file by clicking the  button and then selecting the Export to CSV with identifications option. Files exported these way are provided in directory Processed Spots/CSV/ of the sample data.