S2P
S2P
Tutorial: case study 1
This quick-start tutorial will guide you through all the steps needed to (i) import a set of Progenesis SameSpots reports, (ii) load a MALDI plate, (iii) import protein identifications from a Mascot report, and (iv) use the integrated analysis view of S2P. Finally, it is also shown how to use S2P to load data from Progenesis SameSpots CSV files containing different information than the HTML reports.
Contents
- Download the sample dataset
- Import a Progenesis SameSpots report
- Load a MALDI plate
- Import Mascot identifications
- Integrated data analysis
- Import Progenesis SameSpots CSV files
1. Download the sample dataset
Before using S2P, please, download the sample dataset here and uncompress it. You will find a README.txt file explaining the contents of the dataset, namely:
- Samespots Report: directory containing the HTML files corresponding to the reports generated by Progenesis SameSpots.
- Samespots CSV: directory containing the CSV files corresponding to the files generated by Progenesis SameSpots.
- Spots: a directory contaning the CSV files generated by S2P to store spots data.
- Maldi plate: contains files related with Maldi plates.
- Mascot identifications: contains files related with the Mascot identifications.
This dataset contains spots data from seven patients diagnosed with Bladder cancer, seven patients diagnosed with LUTS and a pool of six healthy volunteers. Each sample was analyzed using 2D-gel electrophoresis. Then, the Progenesis SameSpots software was used to compare each one of the fourteen samples against the healthy pool sample. Differentially expressed spots (those in Samespots Report directory) were excised and analysed through MALDI-TOF mass spectrometry. Obtained spectra were submitted to Mascot in order to obtain a list of protein identifications.
2. Import a Progenesis SameSpots report
S2P allows you to import data from a Progenesis SameSpots experiment report (i.e. a set of one or more HTML files). This report is generated by the Export report option of Progenesis SameSpots. Note that reports in this dataset (Samespots Report directory) has been generated from pairwise comparisons between the experimental samples.
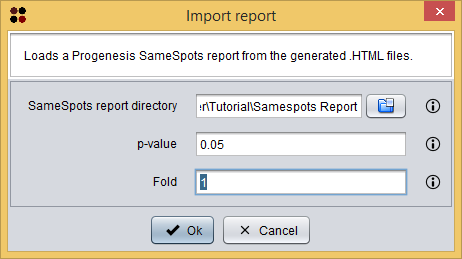
These reports can be imported into S2P using the menu Import/Samespots/Report from HTM files ( ), which will show you the Import SameSpots report dialog. As you can see in the following image, this dialog requires you to provide the following information:
- SameSpots report directory: the directory where the SameSpots report files are stored. Please, note that you must select the directory Samespots Report provided in the sample data and not each individual file inside this directory.
- p-value: the maximum p-value allowed for spots to be loaded. Spots within a higher p-value will not be loaded.
- Fold: the minimum fold allowed for spots to be loaded. Spots within a lower fold will not be loaded.
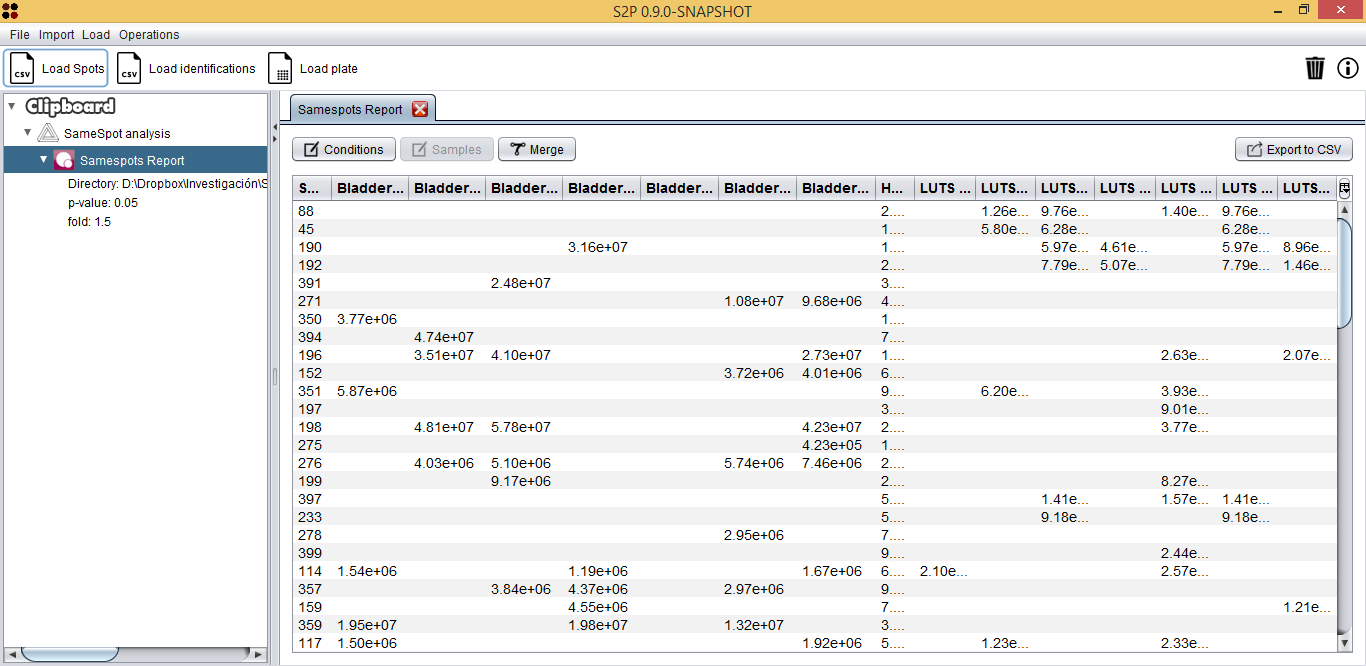
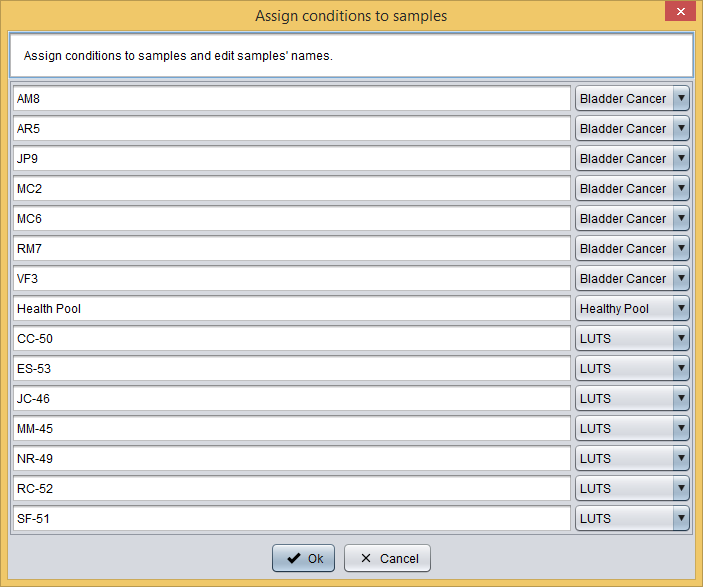
Once the reports have been imported, the SameSpots analysis editor is opened. This interface allows you to: edit spots identifiers, define the experiment conditions, assign them to samples, edit samples' names, merge samples and export the spots into a CSV file.
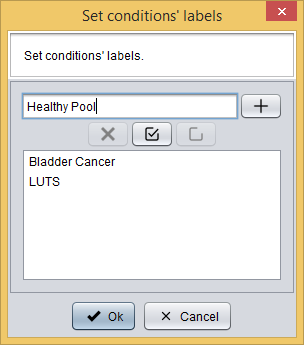
First, you have to define the experiment conditions by clicking the  button, which will show you the following dialog where you must add the experiment conditions.
Secondly, you have to assign each sample to one condition and edit samples' names by clicking the  button, which will show you the following dialog where you can do this.
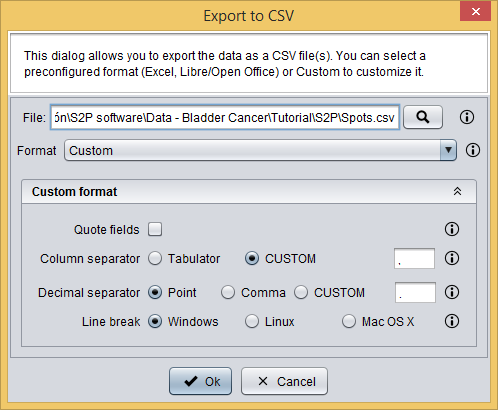
Finally, you have to export the prepared spots data into a CSV file by clicking the  button, which will show you the following dialog. This dialog allows you to select a file to save your data as well as to define the CSV format.
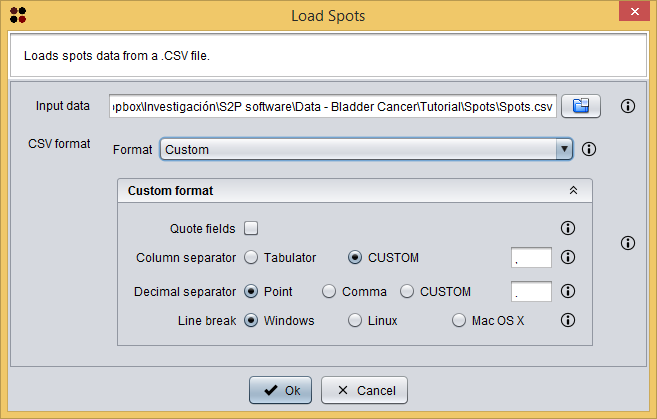
Once spots are exported into a CSV file, this new data is automatically opened by S2P. This file is also provided with the sample data at Spots/Spots.csv and it can be opened by using the  button, which will show you the Load Spots dialog. This dialog just requires you to provide the *.CSV file of the spots and the CSV format of the file. In the case of the Spots/Spots.csv file, it has a `Custom format` where fields are not quoted, `,` is the column separator, `.` is the decimal separator, and `Windows` is the line break.
3. Load a MALDI plate
S2P allows you to desing MALDI plates for your experiments and print them into PDF so that they can be used inside the laboratory.
Sample data provided includes the MALDI plate for this experiment at Maldi plate/BladderCancerProject.mpl. This plate can be loaded into S2P using the menu Load/Maldi plate ( ), which will show you the Load MALDI plate dialog. This dialog just requires you to provide the mpl file of the plate. Once the plate is loaded, it will be opened in the MALDI plate editor.
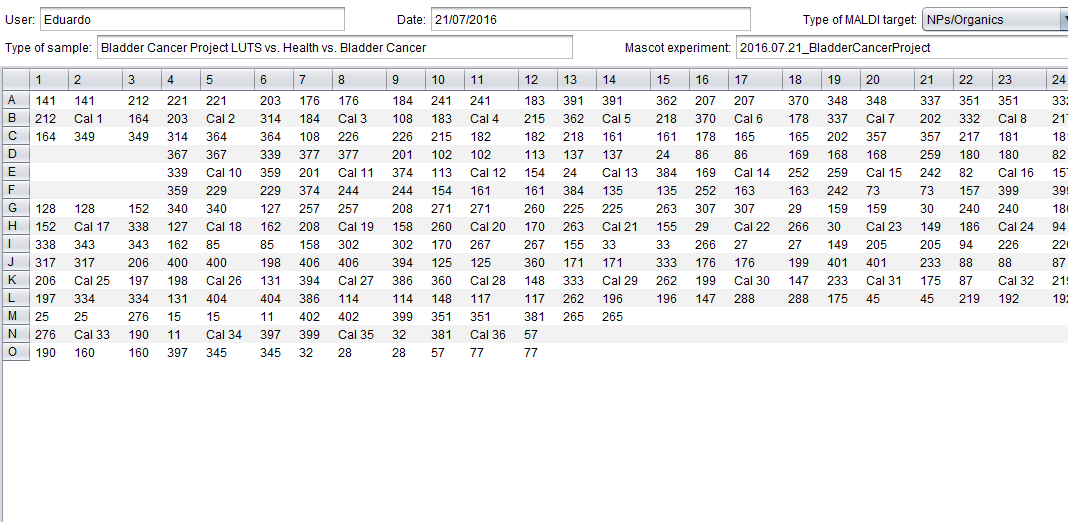
This interface is analogous to the one used to create MALDI plates from scratch and allows you to define some metadata (user, date, etc.) as well as the content of the plate itself.
4.Import Mascot identifications
S2P allows you to import protein identifications from a Mascot report (HTML file). The report that we are going to load for this tutorial is included with the sample data at Mascot identifications/2016.07.21_BladderCancerProject.BTR.HTM.
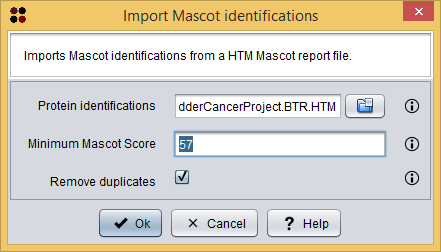
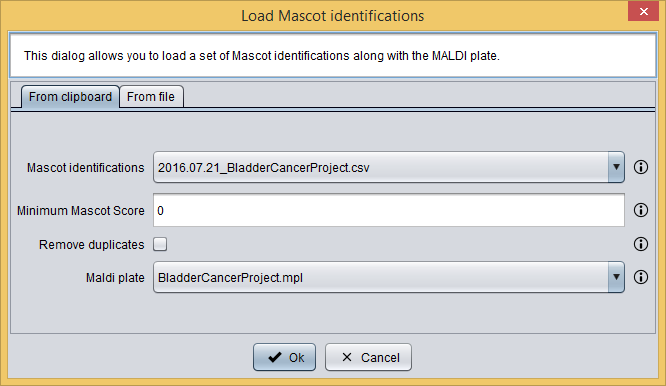
This HTML report can be imported into S2P using the menu Import/Mascot identifications ( ), which will show you the Import Mascot identifications dialog. As you can see in the following image, this dialog requires you to provide the following information:
- Protein identifications: the Mascot HTML report file.
- Minimum Mascot Score: the minimum Mascot Score allowed for identifications to be loaded. Identifications within a lower Mascot Score will not be loaded.
- Remove duplicates: whether duplicated identifications must be removed or not.
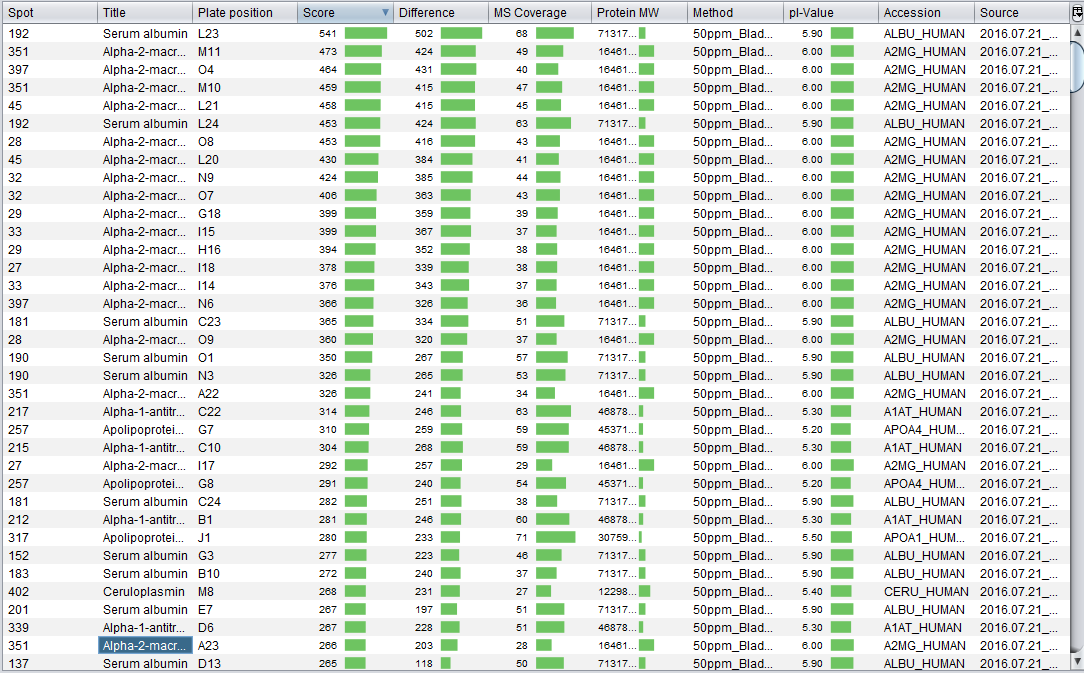
Once the report have been imported, the Mascot identifications table is opened. This interface allows you to: remove undesired protein identifications and export the protein identifications into a CSV file.
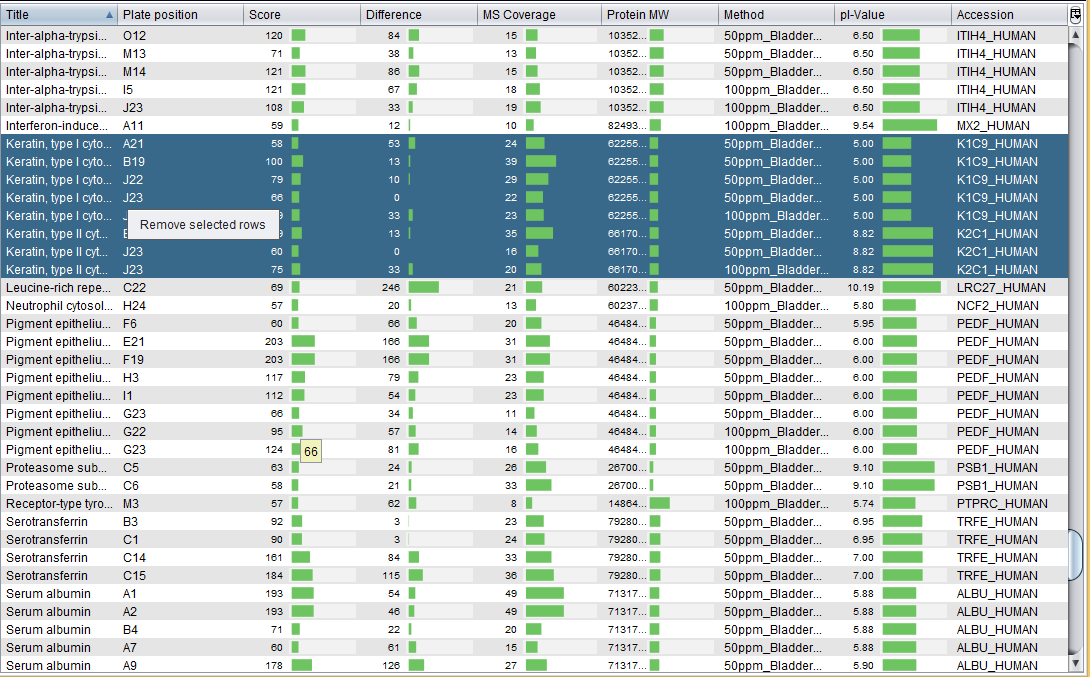
As the image above shows, S2P allows you to remove protein identifications (e.g. Keratins, which can be result of contamination). Finally, we have exported this data into a CSV file, which is provided with the sample data at Mascot identifications/2016.07.21_BladderCancerProject.csv. If you want to load this CSV file, note that this CSV has a `Custom format` where fields are quoted, `,` is the column separator, `.` is the decimal separator, and `Windows` is the line break.
Tip: Associate Mascot identifications to spots using the MALDI plate
Instead of loading the MALDI plate and Mascot identifications files and integrate them into the analysis as the following step shows, you can associate these two files previously in order to create a Spot identifications data. This new data can be integrated later into the Integrated analysis view and saved as a CSV file. This is useful in experiments involving several MALDI plates and Mascot identification reports.
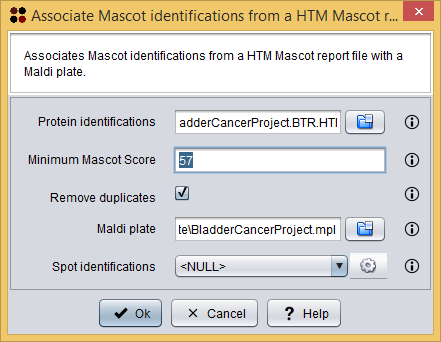
This procedure can be done using the menu Operations/Associate Mascot identifications from a Mascot HTM report file ( ), which will show you the Associate Mascot identifications dialog. As you can see in the following image, this dialog requires you to provide the following information:
- Protein identifications: the Mascot HTML report file.
- Minimum Mascot Score: the minimum Mascot Score allowed for identifications to be loaded. Identifications within a lower Mascot Score will not be loaded.
- Remove duplicates: whether duplicated identifications must be removed or not.
- Maldi plate: the Maldi plate file.
- Spot identifications: the destination data where the new associations must be added.
Once the two files has been associated, the Spot Mascot identifications table is opened. This interface allows you to: remove undesired protein identifications and export the spot Mascot identifications into a CSV file. As you can see in the image bellow, this is essentially the Mascot identifications table with an additional column indicating the spot.
We have also exported this data into a CSV file, which is provided with the sample data at Mascot identifications/2016.07.21_BladderCancerProject_Associated.csv. If you want to load this CSV file using the Load/Load spot identifications operation, note that this CSV has a `Custom format` where fields are quoted, `,` is the column separator, `.` is the decimal separator, and `Windows` is the line break.
5. Integrated data analysis
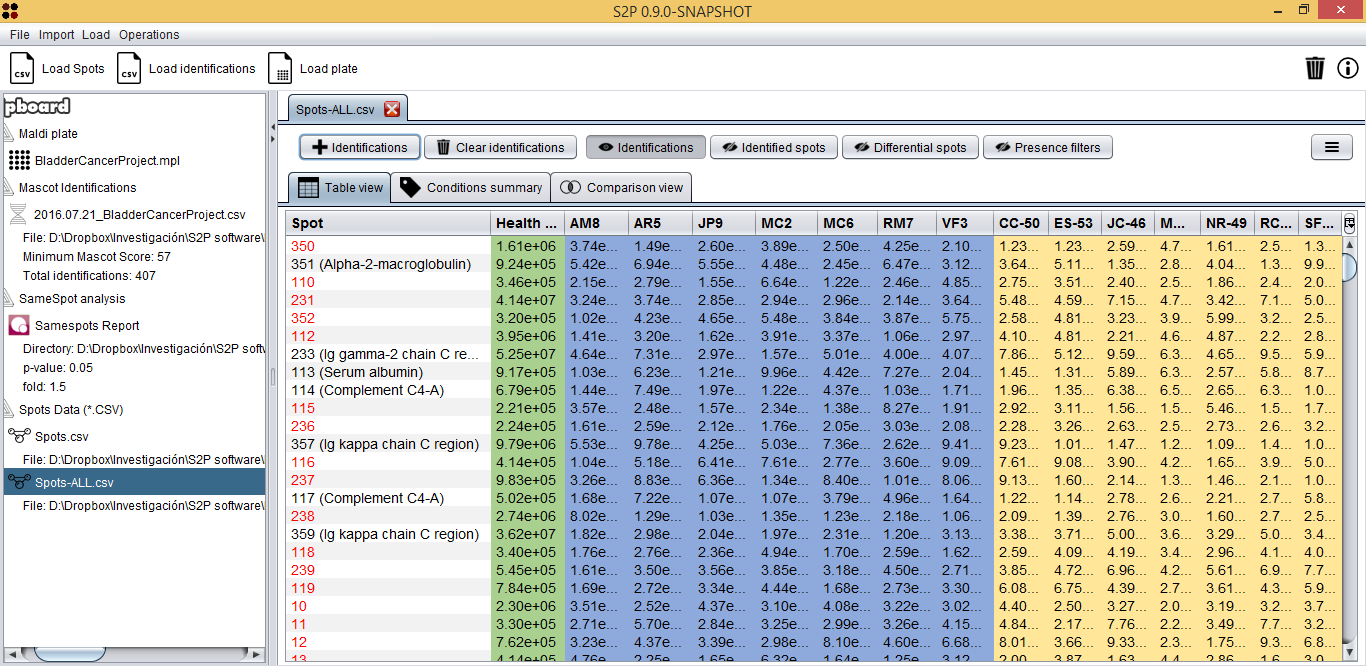
At this moment, you have loaded three types of data: spots, MALDI plate and Mascot identifications. By clicking on the Spots.csv item the Integrated analysis view will be opened.
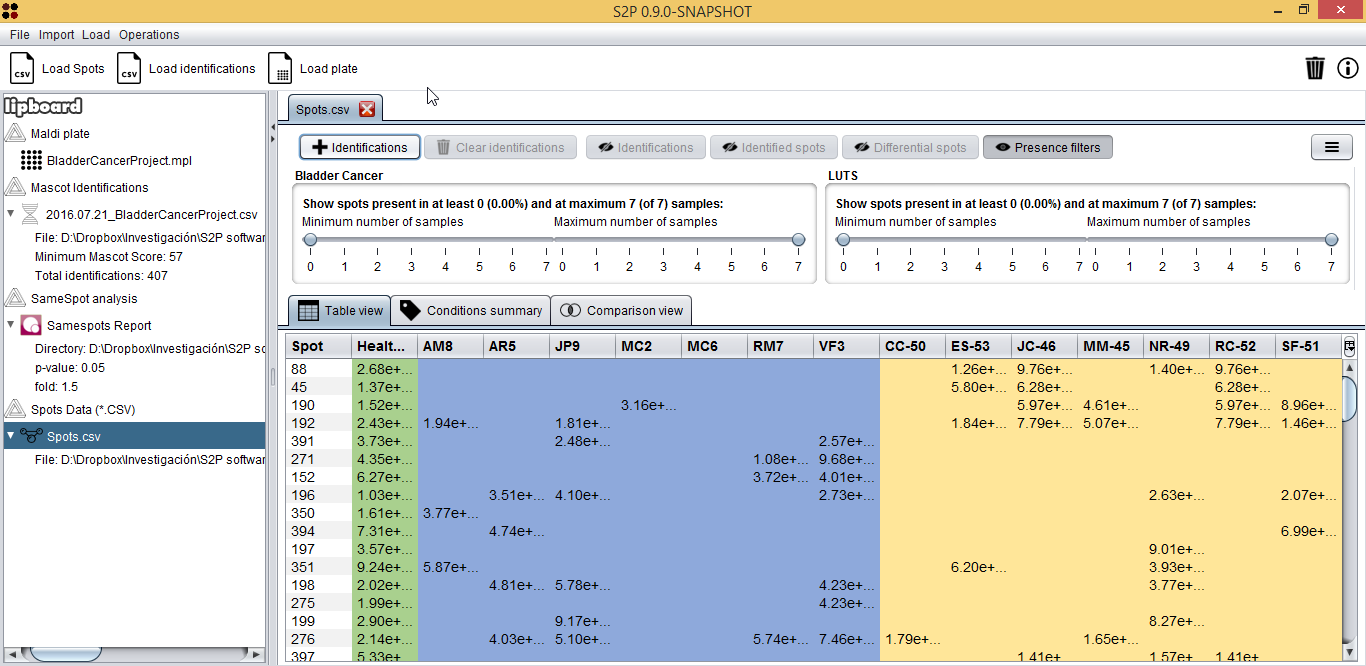
This view has two main parts: the upper part with buttons and controls and the lower part with different views to explore spots data. This lower part, has, at the same time, three tabs to explore spots data in different ways:
- Table view (shown above): shows samples in columns and spots in rows. Cell values represent the expression value for the given spot and sample.
- Conditions summary: shows a summary of the conditions in the dataset with spots in rows and conditions in samples. For each spot, four columns are shown: average spot value, standard deviation, porcentage and count of samples where the spot is present.
- Comparison view: shows a comparison of two conditions, allowing you to check what spots are common of both and what are unique.
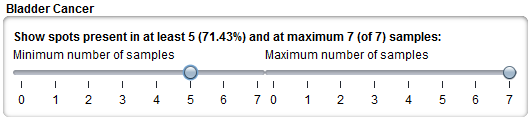
Regarding the Table view, one of the first useful things is finding spots that are present in one condition and not in the other by using the sliders upper the table. In our case, for example, it would interesting to check if there are spots that are in at least five of seven Bladder cancer samples, so we used the slider to establish this filter.
Now, in order to integrate the Mascot identifications into this analysis you should click the  button, which will show you the Add identifications dialog. As you can see in the following image, this dialog allows you to select a pair of previously loaded Mascot identifications and MALDI plate.
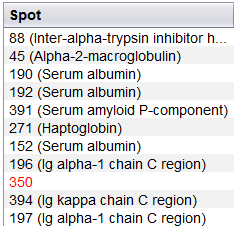
After adding this information to the analysis, tables will automatically show the best Mascot identification (i.e. that with a higher Mascot Score) along with the spot number or mark in red those spot without identifications associated.
Finally, you can also use the following control buttons in the upper part to accomplish different tasks:
 : allows you to remove the loaded identifications from the analysis view.
 : select this button to show only spots with protein identifications associated and hide those that have not identifications associated.
 : select this button to show the best protein identification along with the spot number in tables.
 : select this button to show only differential spots. When this option is selected, a dialog to define how differential spots are computed is shown.
 : select this option to show the presence filters by condition.
6. Import Progenesis SameSpots CSV files
The Samespots Report directory contains the HTML report files generated by SameSpots where there are only differentially expressed spots between each sample and the healthy pool. However, SameSpots also allows exporting all spots (differentially expressed or not) as CSV files (using the File/Export spot measurements option). These files are provided in the Samespots CSV directory of the sample data.
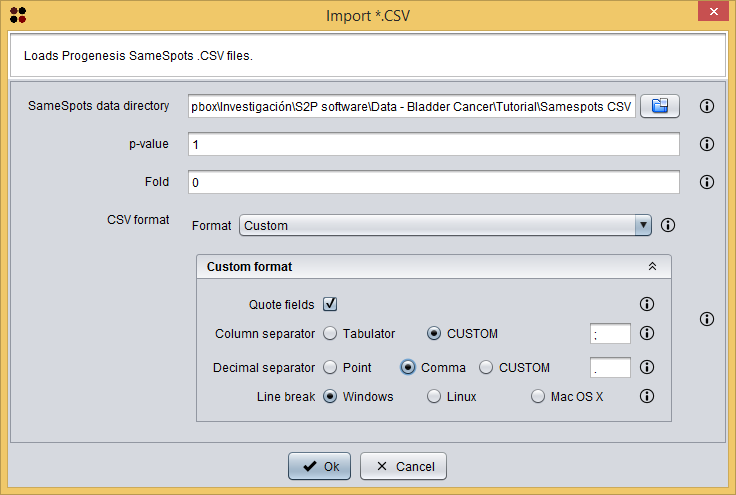
In order to import this data into S2P you have to do the same that you have done to import a Progenesis SameSpots report but using the menu Import/Samespots/Import *.CSV ( ) instead. This option will show you the following dialog, were you also have to choose the format of the CSV files (`Custom format` where fields are quoted, `;` is the column separator, `,` is the decimal separator, and `Windows` is the line break). Please, note that you must select the directory Samespots CSV provided in the sample data and not each individual file inside this directory.
Now, the process is the same that the one done for the report: add conditions, edit samples and export the data as CSV. This CSV file containing all spots data is provided in the sample data at Spots/Spots-ALL.csv. After loading this file and integrating the Mascot identifications, you will notice that the Integrated analysis view shows expression values for all samples and spots in the table.
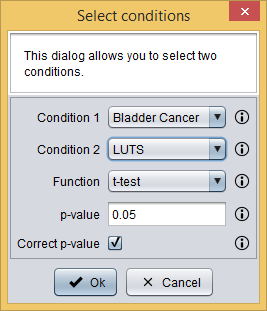
Since we have expression values for all samples, we can perform a t-test to check if there are spots whose average mean is statistically different between Bladder cancer and LUTS. This can be done by clicking the button , which will show you the following dialog. As you can see in the image bellow, it requires you to provide the following information:
- Condition 1: first testing condition. Bladder cancer in this case.
- Condition 2: second testing condition. LUTS in this case.
- Function: the statistical test to compare means. t-test in this case.
- p-value: the maximum p-value to consider that a difference is statistically significant. 0.05 in this case.
- Correct p-value: whether p-values should be corrected using the Benjamini-Hochberg method.
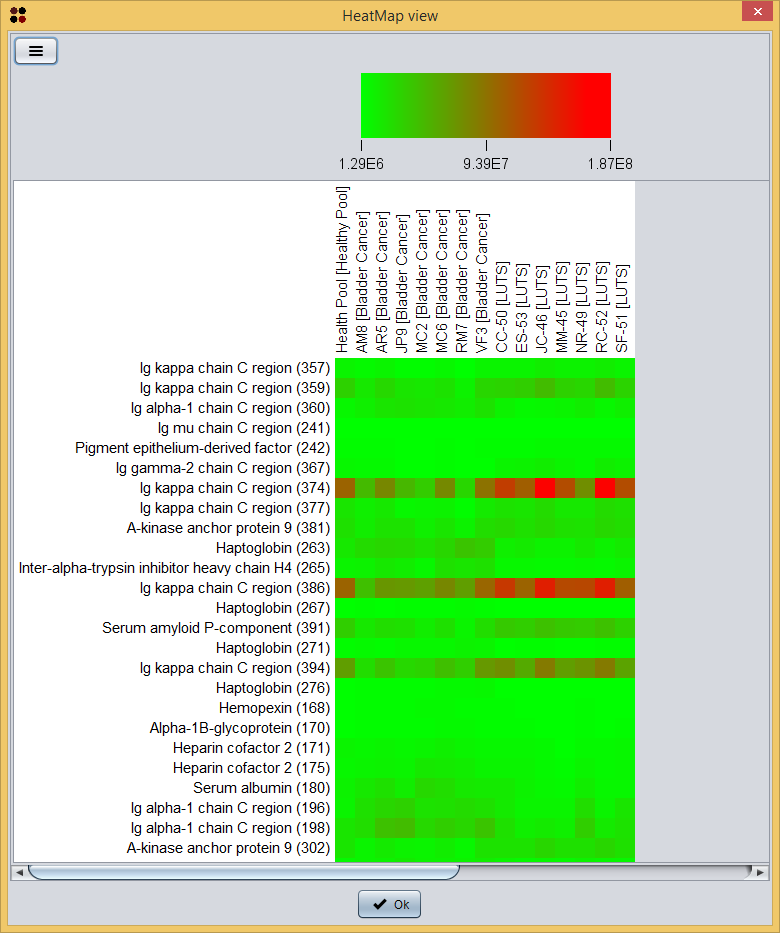
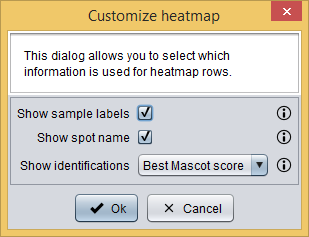
By doing this, only spots whose average mean is statistically different between Bladder cancer and LUTS are shown in the table. Now, you can visualize this information as a heatmap by clicking the  button and then selecting the View as heatmap option, which will show you a dialog to customize the heatmap information. As you can see in the image bellow, it requires you to provide the following information:
- Show sample labels: whether sample labels should be shown in the heatmap or not.
- Show spot name: whether spot names should be shown in the heatmap or not.
- Show identifications: choose how protein identifications should appear in the heatmap:
- None: identifications are not shown.
- Best Mascot score: only the identification with the best Mascot score is shown.
- All identifications: all identifications are shown.
And, finally, the heatmap is shown.