 bicycle
Using bicycle in Windows with Docker
This tutorial shows you how use bicycle in Windows with Docker and how to use bicycle to perform a simple bicycle analysis using simulated sample data.
1. Install the Docker Toolbox
Download the Docker Toolbox installer here and install it in your computer. For inexperienced users, it is recommended to perform a full installation. For detailed instructions, see the official Docker Toolbox documentation.
Note: If you have a previous version of VirtualBox installed, do not reinstall it with the Docker Toolbox installer. When prompted, uncheck it.
2. Configure the default VirtualBox Virtual Machine
The Docker Toolbox uses VirtualBox to create a Virtual Machine (VM) where Docker resides. In this step, you must configure the default VM in order to increase the memory and CPUS that the VM can use.2.1 Open Oracle VirtualBox
Open Oracle VirtualBox using the Windows launcher menu (the same you use to open other software). The following window will appear.

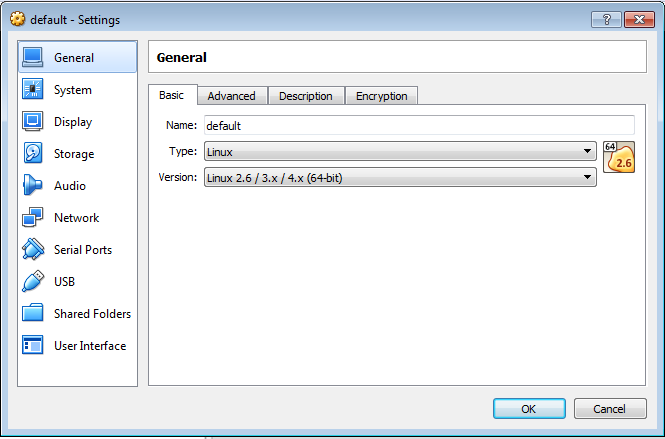
2.2 Open the default VM settings
Open the default VM settings by selecting it and clicking the Settings button. The following dialog will appear.
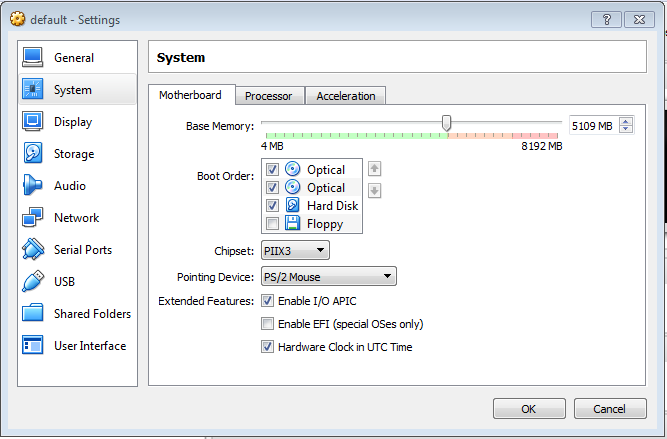
2.3 Increase the base memory
In order to increase the VM base memory, you should go to System section (in the left menu bar of the settings dialog). The Motherboard tab allows you to specify the Base Memory parameter. Set it to the maximum allowed.
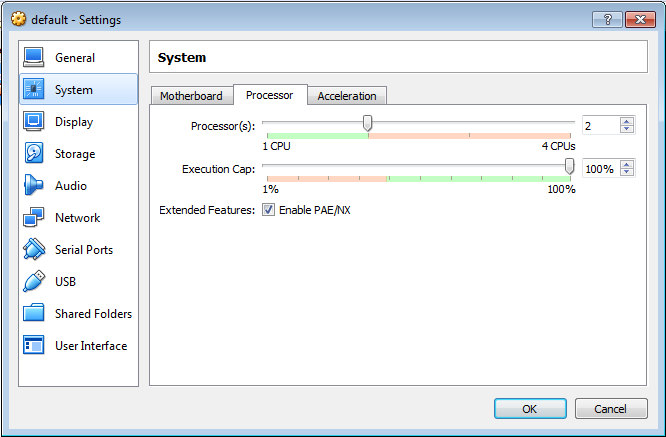
2.4 Increase the CPUs
In order to increase the VM processors (or CPUs), go to tab Processor and set the Processor(s) parameter to the maximum value allowed.
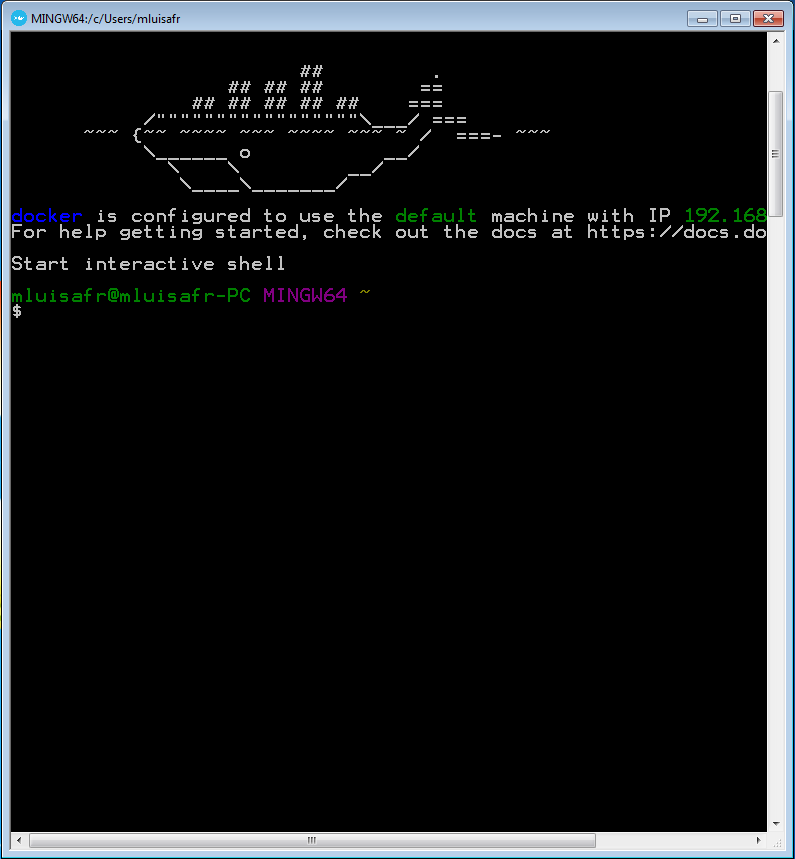
3. Verify your installation
Once Docker Toolbox is installed and the VM settings configured, it is time to verify that everything works and that you can run bicycle. To do so, open the Docker Quickstart Terminal program (you can open it with the Windows launcher menu or a desktop icon). The following window will appear. The first time that this program is opened, VirtualBox may ask you for permissions to make changes in your computer so that you must accept all of them.
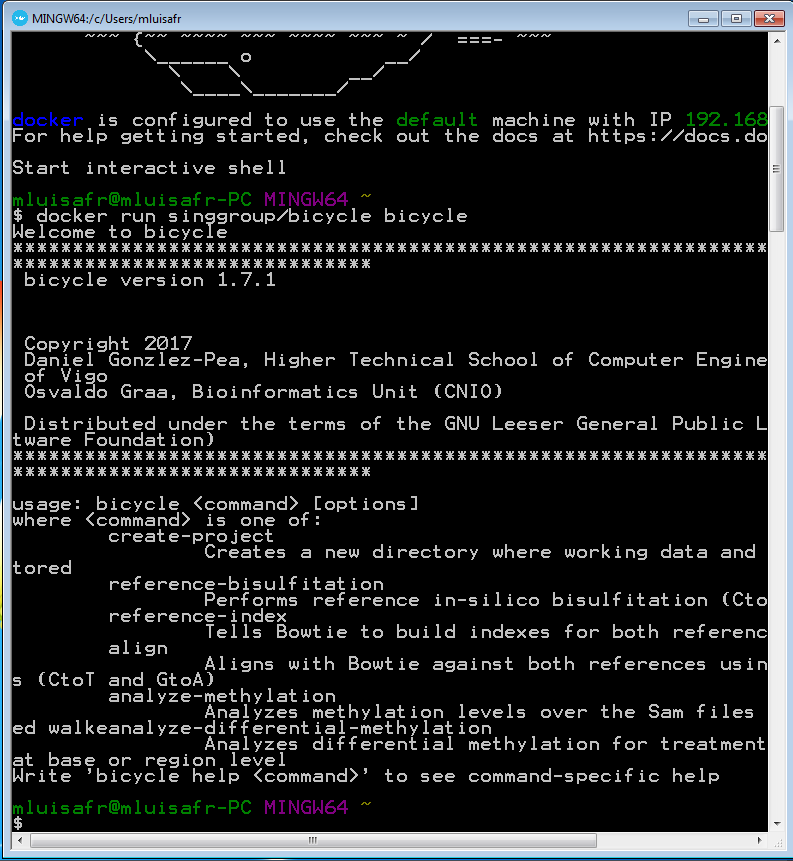
When the prompt is ready, run the following command in order to download the latest bicycle image and show the bicycle help:
docker run singgroup/bicycle bicycle
It may take a while because it is the first time that you use the bicycle image and it must be downloaded. Next commands will run immediately. Once the image is downloaded, the bicycle help is shown. If you see the same output that the one in the following image, then everything is right.
4. Use bicycle to analyze the simulated data
This step shows you how to perform a simple bicycle analysis using simulated sample data.
4.1 Download the sample data
Download the sample data by clicking here. Decompress it into a folder called sample-data at a known location (e.g. C:\Users\YourUser\bicycle).
4.2 Use the Docker Quickstart Terminal to navigate to the data directory
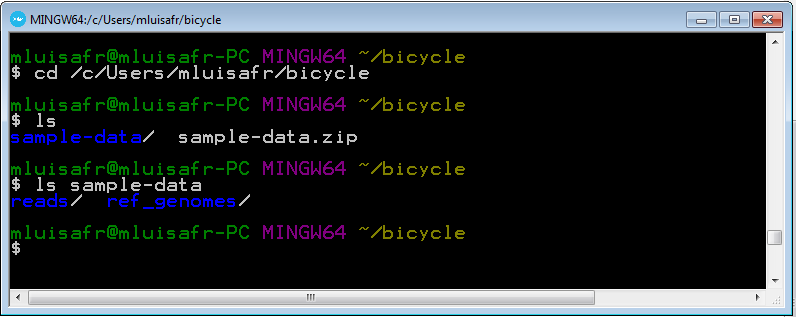
Go to the Docker Quickstart Terminal window and navigate to the data directory. If you have extracted the sample data at C:\Users\YourUser\bicycle, then type the following command (please, replace YourUser with your actual Windows username):
cd C:\Users\YourUser\Downloads
Then, type the two following commandds in order to check that you are in the righ directory.
ls
ls sample-data
You must obtain the following lists of files:
4.3 Declare a variable with the bicycle command
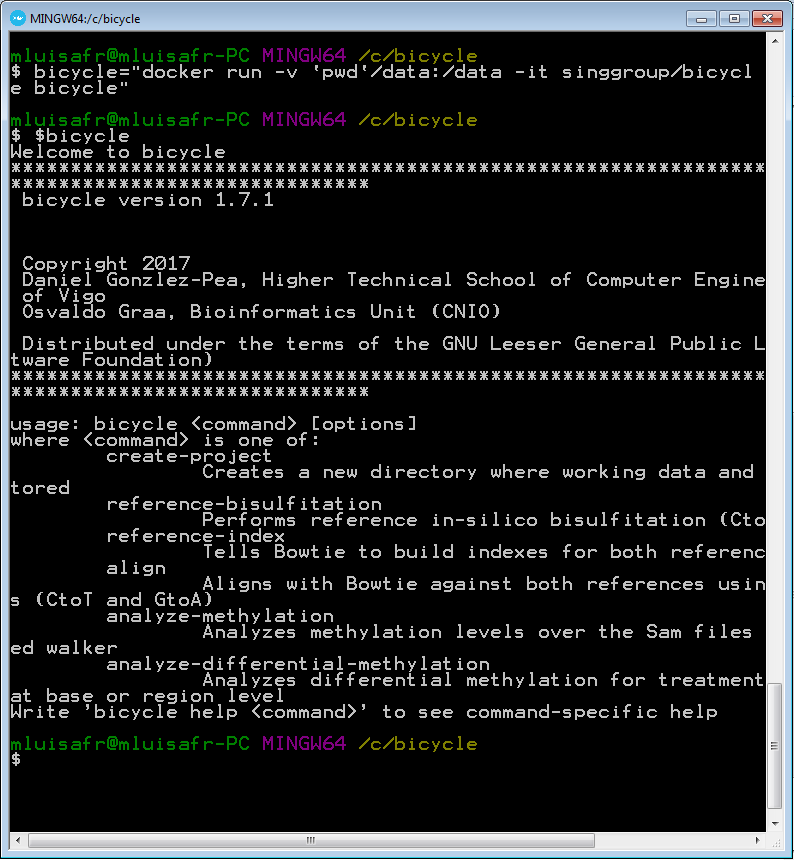
Run the following instruction in order to define the bicycle command under docker. Your sample-data directory will be seen insice docker as /data:
alias bicycle="docker run --rm -v `pwd`/sample-data:/data -it singgroup/bicycle bicycle"
Now, run the following command in order to check that the bicycle command is right:
bicycle
4.4 Create a project
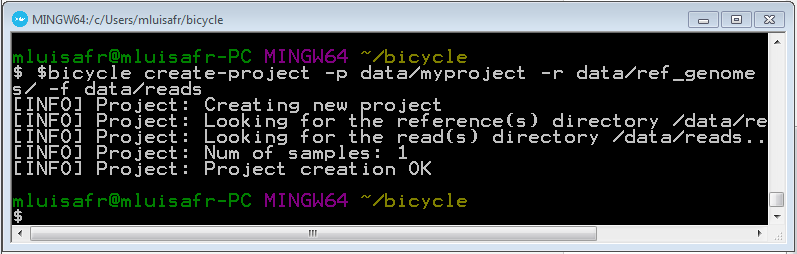
Run the following command in order to create a new bicycle project.
bicycle create-project -p data/myproject -r data/ref_genomes/ -f data/reads
4.5 Create the Watson and Crick in-silico bisulfited reference genomes
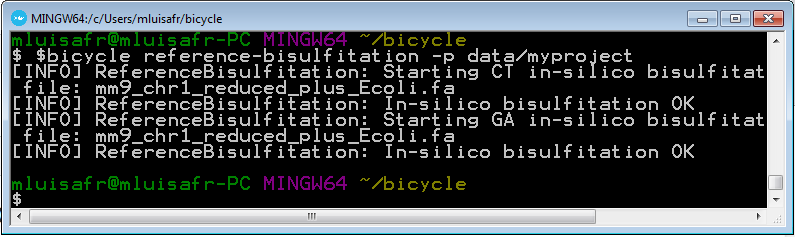
Run the following command in order to create the Watson and Crick in-silico bisulfited reference genomes.
bicycle reference-bisulfitation -p data/myproject
4.6 Create the bisulfited reference genome indexes
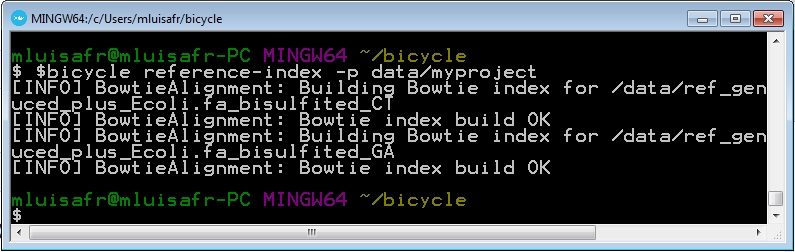
Run the following in order to create the bisulfited reference genome indexes.
bicycle reference-index -p data/myproject -t 4
4.7 Align reads to both references
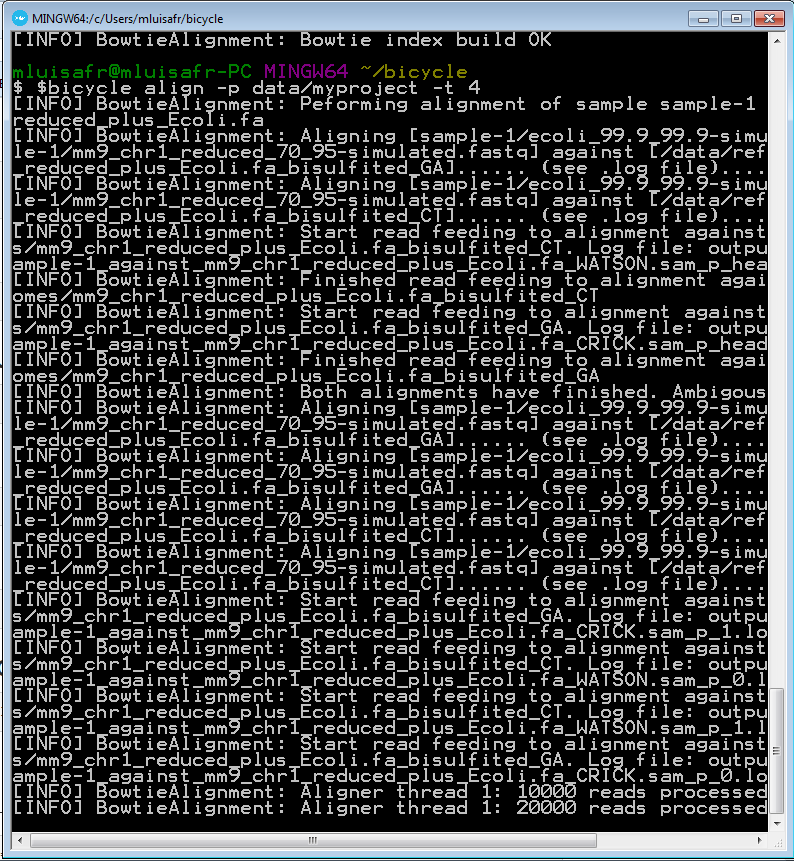
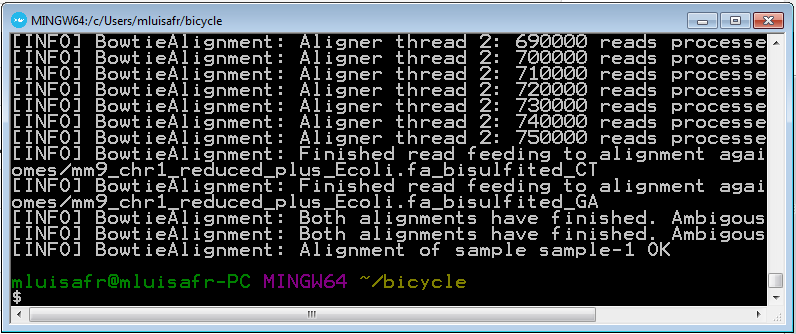
Run the following command in order to perform the reads alignment against both references.
bicycle align -p data/myproject -t 4
4.8 Perform methylation analysis and methylcytosine calling
Run the following command in order to perform the methylation analysis and methylcytosine calling.
bicycle analyze-methylation -p data/myproject -n 4 -a -e from_control_genome=Ecoli
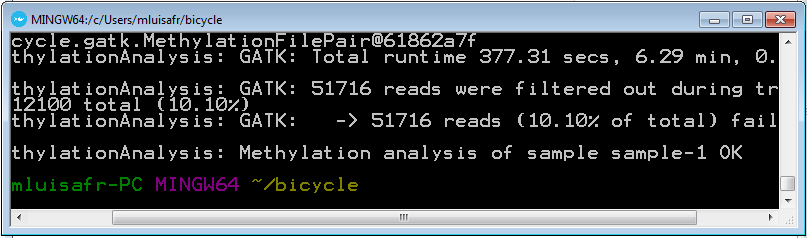
4.9 Check the results
You are finished! You can explore the summary output file sample-data/myproject/output/sample-1_mm9_chr1_reduced_plus_Ecoli.fa.summary (in bold there are the detected errors in Ecoli and the methylation level, as expected from simulated data).
	====METHYLATION RESULTS=======================================================
	File: sample-1_mm9_chr1_reduced_plus_Ecoli.fa.summary
	Date: Mon May 29 12:56:39 CEST 2017

	====ANALYSIS PARAMETERS=======================================================
	Correct non-CG: true
	Filters:
	remove ambiguous reads: true
	remove non-correctly bisulfite-converted reads: true
	trim to 'x' mismatch: true x=4
	remove clonal reads: false
	FDR threshold: 0.01

	====ERROR ESTIMATION AND SIGNIFICANCE ADJUSTMENTS=============================
	Error rates (from control genome: Ecoli):
	  WATSON={CG=9.686509334272632E-4 (1265/1305940), CHG=0.0010630211982115276 (1179/1109103), CHH=0.0010214901652048762 (2076/2032325)}
	CRICK={CG=0.0010030059599348046 (1312/1308068), CHG=0.001042832963281255 (1154/1106601), CHH=9.824304531497866E-4 (1970/2005231)}

	p-value cutoffs: {WATSON={CHH=9.515226330187381E-5, CG=0.01494593925387917, CHG=9.853761678579196E-5}, CRICK={CHH=9.471328057717618E-5, CG=0.01481125092524056, CHG=9.836380454616681E-5}}

	====METHYLATION ANALYSIS RESULTS==============================================
	---- GLOBAL --------
	Called methylcytosines (pval<cutoff)
	total: 108033/3898156 (0.027713872918374738)
	per context called methylcytosines:  CG:0.6686382864495108 CHG:0.0720890838910333 CHH:0.2592726296594559
	CG called methylcytosines: 72235/120785 (0.5980461149977232)
	CHG called methylcytosines: 7788/798844 (0.009749087431338285)
	CHH called methylcytosines: 28010/2978527 (0.009403977200811004)
	Methylation Levels:
	 CG: 107826/364342 (0.2959472144303978)
	CHG: 118475/2427700 (0.048801334596531694)
	CHH: 436883/9009617 (0.048490740505395515)
	non-CG corrections: 0

	... (more)