 S2P
S2P
Tutorial: case study 3
This quick-start tutorial will guide you through all the steps needed to (i) import Mascot quantifications reports, (ii) explore the quantifications in different ways, and (iii) export data. Finally, a brief discussion of the the case study results is presented.
Contents
1. Download the sample dataset
Before using S2P, please, download the sample dataset here and uncompress it. You will find a README.txt file explaining the contents of the dataset, namely:
- S2P-Data: Mascot quantification reports prepared to be loaded with S2P. This directory contains three directories corresponding to the three sub datasets prepared for this case study.
- Results: case study result files.
This dataset contains Mascot quantification reports corresponding to the LC-MS/MS analysis of the blood serum of a patient with osteoarthritis. From this blood serum, four samples were taken. These four samples were divided into two groups: ON, with two samples whose proteins were digested using the classic overnight method1; and US, with two samples whose proteins were digested using the ultrasonic accelerated method using the microplate horn assembly device2.
The Mascot search engine was used for protein identification and to determine the emPAI values for each identified protein. Mascot reports containing emPAI values were exported using the “Export” option in Mascot Search Results, which creates a CSV file of each LC-MS/MS run (i.e. 8 files in this case).
Samples are organized in three different ways in order to perform three different comparisons: (i) Overnight sample 1 vs. Overnight sample 2; (ii) Ultrasonic sample 1 vs. Ultrasonic sample 2; and (iii) Overnight vs. Ultrasonic samples.
2. Import Mascot quantifications reports
S2P allows you to import the Mascot quantifications reports from the CSV files obtained using the Export option in the Mascot Search Results interface.
These reports must be arranged following a specific directory organization. For a detailed description, look at the S2P integrated user manual. The three sub datasets provided within this dataset already meet this requisite.
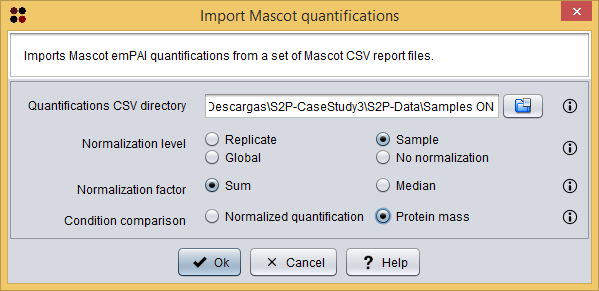
Each sub dataset can be imported into S2P using the menu Import/Import Mascot quantifications, which will show you the Import Mascot quantifications dialog. As you can see in the following image, this dialog requires you to provide the following information:
- Quantifications CSV directory: the directory containing the quantifications reports organized as S2P needs.
- To follow the tutorial, select the directory Samples ON.
- Normalization level: the level at which normalization should be applied
- To follow the tutorial, select Sample.
- Normalization factor: the normalization factor to use. You can shoose one of the following: Sum, to divide each value by the sum of all values at the specified normalization level; or Median, to divide each value by the median of all values at the specified normalization level.
- To follow the tutorial, select Sum.
- Condition comparison: the protein value to use to perform the statistical tests between conditions. You can choose one of the following: Normalized quantification, to perform the statistical tests using the normalized quantification values; or Protein mass, to perform the statistical tests using the protein mass value.
- To follow the tutorial, select Protein mass.
Once the data have been imported, the Mascot quantifications viewer is opened. The Mascot quantifications viewer shows you three tabs with three different tables:
- Replicates.
- Replicates by protein.
- Conditions.
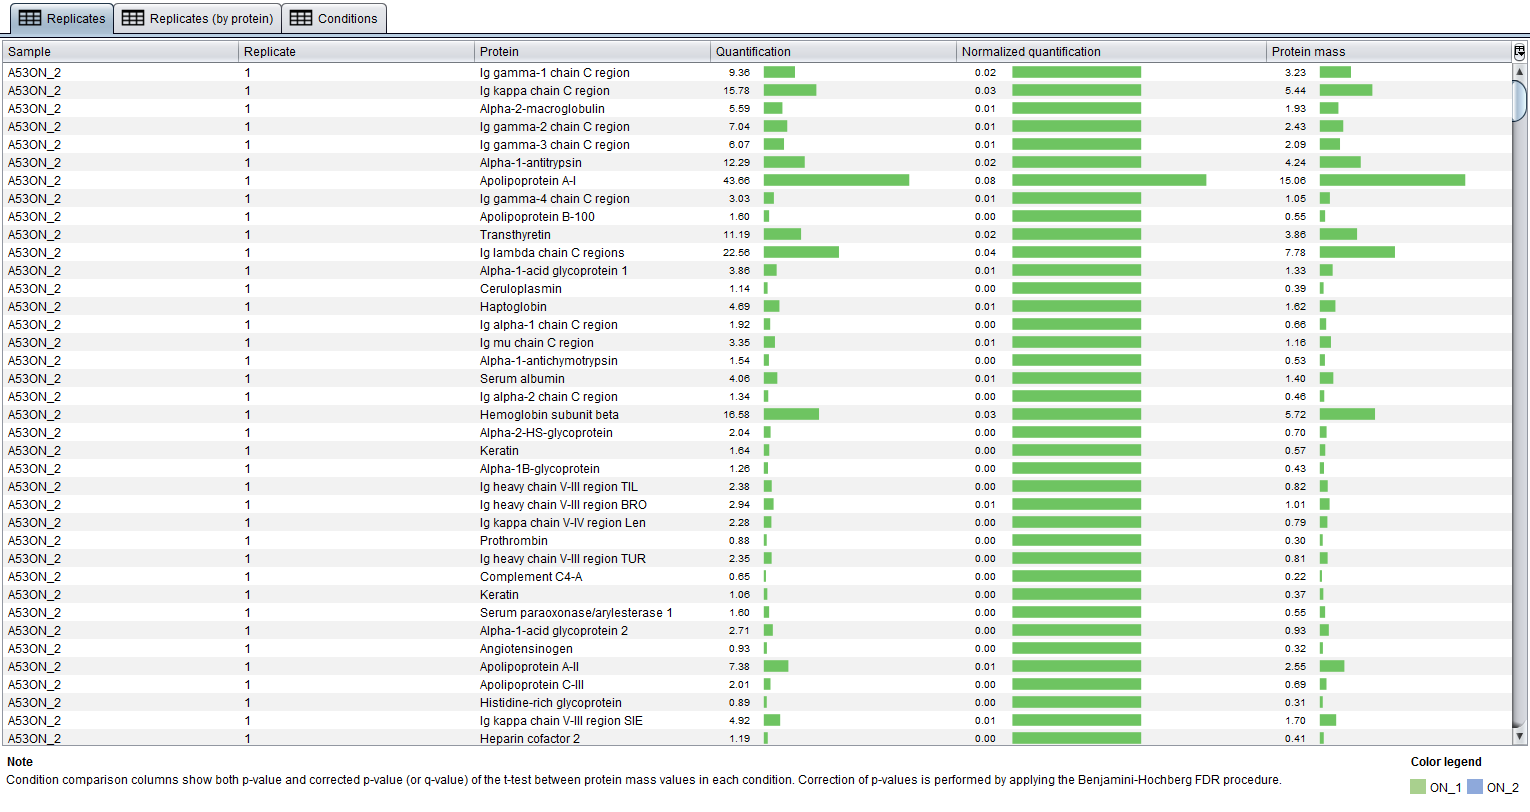
The Replicates table shows you all protein quantifications. Each row represents a protein quantification and as you can see in the image below, columns provide the following information for each one:
- Sample: the sample where this protein quantification comes from.
- Replicate: the number of the sample replicate.
- Protein: the name of the protein.
- Quantification: the emPAI quantification value found in the report.
- Normalized quantification: the emPAI normalized quantification value, calculated using the specified parameters.
- Protein mass: the protein mass calculaded as the product of the emPAI normalized quantification by the protein mass specified for the corresponding sample in the protein-masses.txt file. Please, check the integrated user manual for a deeper explanation about this file.
The information on this table is used to construct the other two tables as it is explained below.
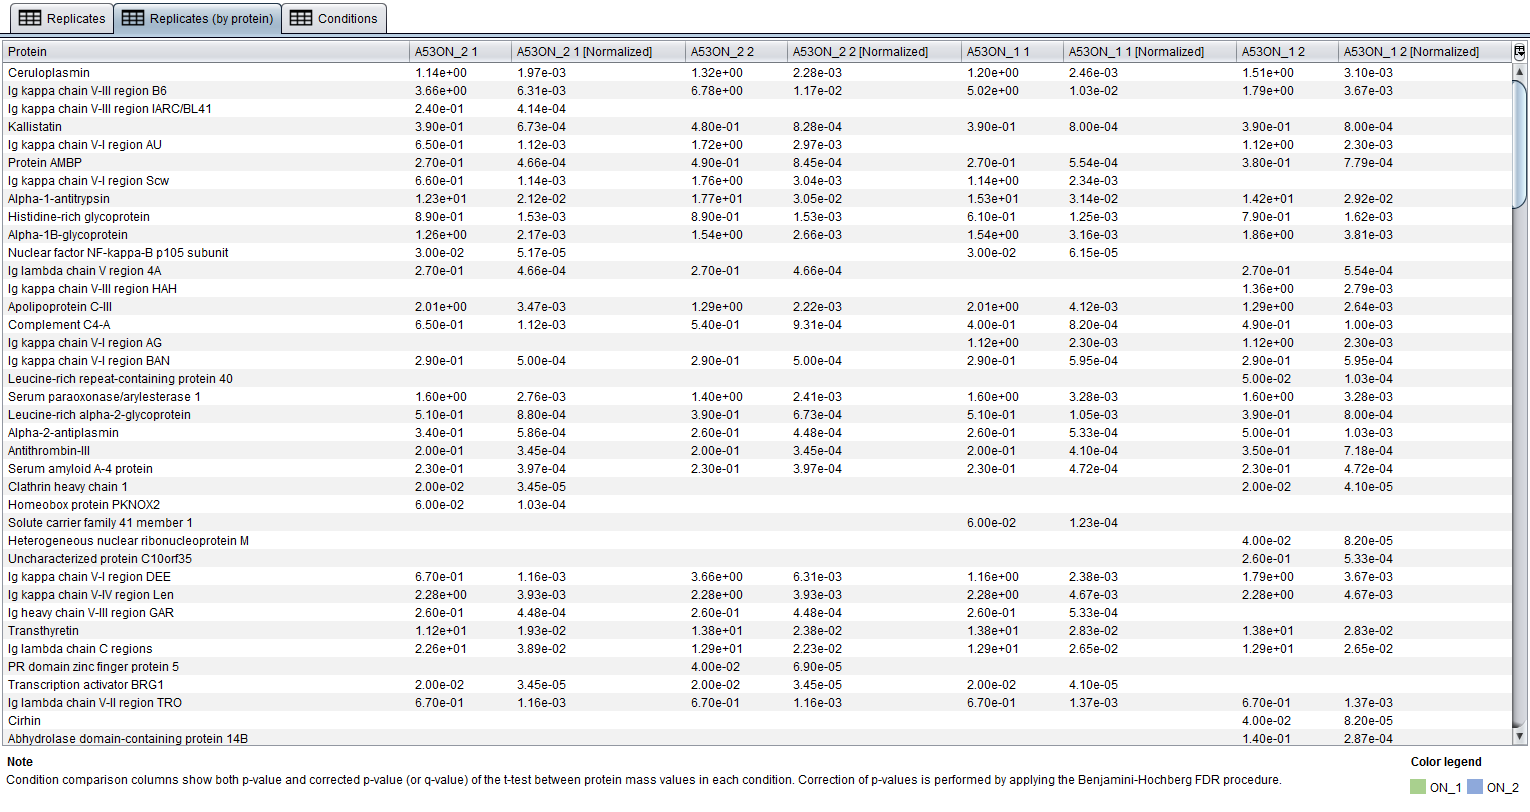
The Replicates by protein table allows you to compare replicates by displaying each protein in a row and protein quantification values for replicates in columns. Protein quantifications at the Replicates table are grouped by their protein names.
Finally, the Conditions table allows you to compare conditions by displaying each protein in a row and conditions in columns. In the case of the Samples ON and Samples US data, there are two conditions corresponding to the two samples so that they can be compared. In the case of the US versus ON data, there are two conditions corresponding to the ON and US methods, each one with their corresponding samples.
Protein quantifications at the Replicates table are grouped by their protein names. Moreover, the final columns of the table show both p-value and corrected p-value (or q-value) of the t-test between protein quantification or protein mass values in each condition. Note that the value used for the t-test is selected in the previous dialog. Correction of p-values is performed by applying the Benjamini-Hochberg FDR procedure.
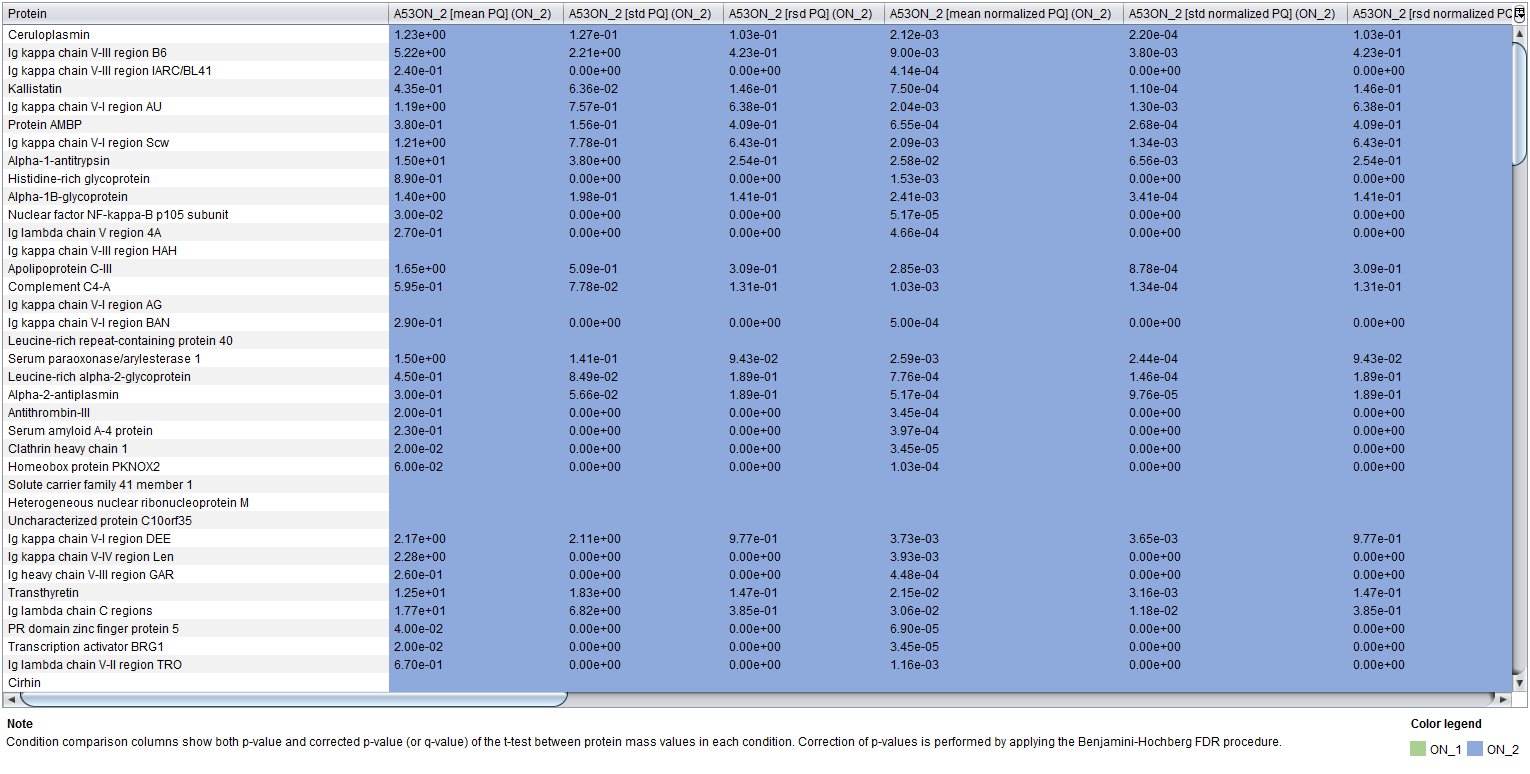
For each condition, the following nine columns are created:
- Columns 1, 2 and 3 show the mean, standard deviation and relative standard deviation (RSD) of protein quantification values in all condition samples.
- Columns 4, 5 and 6 show the mean, standard deviation and relative standard deviation (RSD) of normalized protein quantification values in all condition samples.
- Columns 7 and 8 show the mean and standard deviation of protein mass values in all condition samples.
- Column 9 shows the percentage of presence (POP) of the protein in the condition, calculated as the number of samples where the protein has been quantified divided by the total number of samples in the condition.
Finally, the conditions table can be exported into a CSV file by clicking the  button. The corresponding file for the ON samples is provided at Results/Samples ON.csv.
This procedure must be repeated for the S2P-Data/Samples US and S2P-Data/US versus ON directories. The corresponding CSV files are provided at Results/Samples US.csv and Results/US versus ON.csv, respectively
2. Case study results
In this case study, the condition tables are used to perform three comparisons: (i) Overnight sample 1 vs. Overnight sample 2; (ii) Ultrasonic sample 1 vs. Ultrasonic sample 2; and (iii) Overnight vs. Ultrasonic samples. The exported CSV tables have been processed with Excel in order to calculate the ratios and generate the figure bellow. The Excel spreadsheet containing these tables is provided at Results/Results.xlsx.
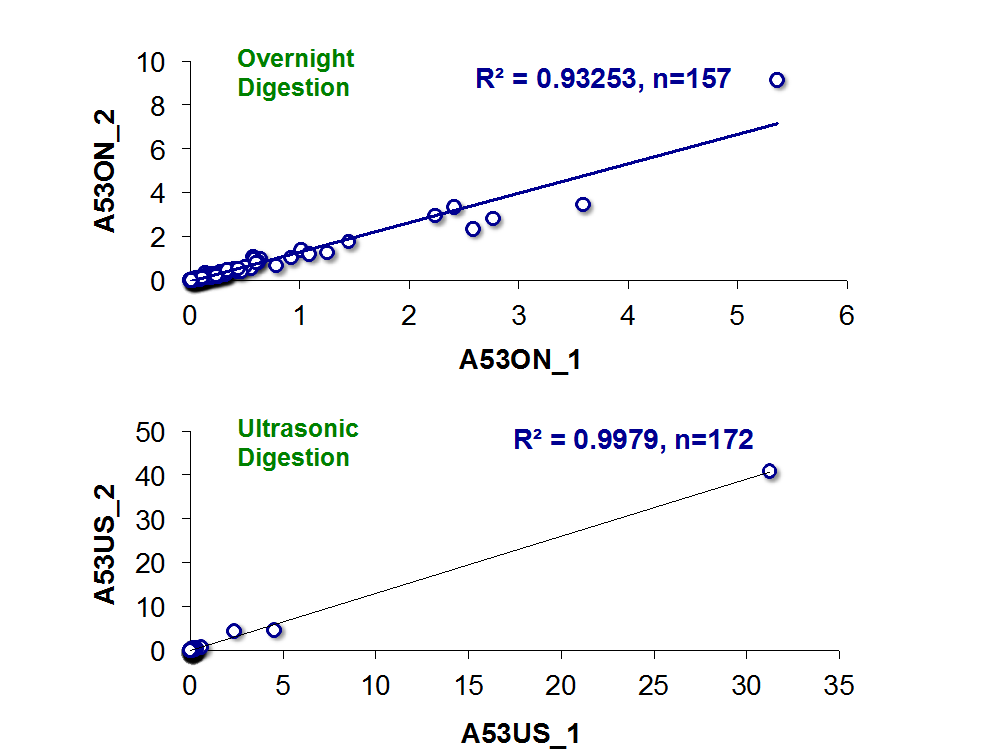
This experimental procedure combined with S2P can be used to: (i) determine the accuracy of the quantification since it is possible to correlate the replicate measurements of the same sample (as in the first two comparisons); and (ii) detect bias towards specific proteins caused by the digestion method (Ultrasonic digestion vs. Overnight Digestion).
The image bellow shows the correlation analysis of emPAI quantification of two serum samples digested overnight (upper plot) and ultrasonic digestion (lower plot). This analysis shows good correlation, R2 = 0.93 (A53ON_1 two LC-MS/MS replicates and A53ON_2 two replicates, 157 quantified proteins) for the Overnight digestion, and R2 = 0.99 (A53US_1 two LC-MS/MS replicates and A53US_2 two replicates, 172 quantified proteins) for the Ultrasonic Digestion. Because these samples are replicates, the expected ratio of A53ON_1: A53ON_2 and A53US_1: A53US_2 is 1. It was observed that both methods exhibit the expected ratio in more than 80% of the quantified proteins.
Also, this experimental data allows detecting bias towards specific proteins due to the digestion method (Ultrasonic digestion vs. Overnight Digestion). The analysis revealed that 31 proteins (q-value < 0.05, Ratio US:ON > 1) were preferentially digested by the Ultrasonic method (UM) leading to an apparent higher concentration of these proteins in the samples digested with the UM in comparison with the samples digested overnight. On the other hand, only two proteins (q-value < 0.05, Ratio US:ON > 1) were preferentially digested using the Overnight method.